Data Labels, Axis Interval, Rotate Label Text: SSRS Nugget

Charts present summary data in a visually appealing format. Following is a chart for sales over month:


image

Before

I frequently use a few options along with charts to get most out of them.

Show data labels:

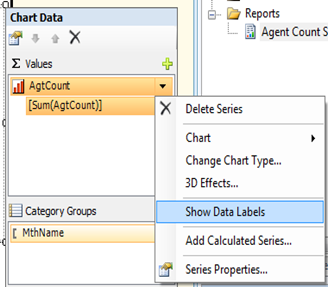
It’ll be easier for the users to quickly read, if the chart shows the actual numbers along with bars. Steps: From the chart data pane, click data value, and choose Show Data Labels.
image

Display all categories on horizontal axis:

Notice in the above chart, all the categories (Months in our example) are not displayed. By default, auto fit property determines the interval of horizontal axis labels. Changing the interval to 1 will force the axis to display all categories. Steps are depicted in the below screen prints.

image

image

Rotate Labels:

Sometimes you may notice the labels are rotated automatically to better fit them, other times labels overlap with each other. Labels can be forced to rotate by disabling auto-fit and changing the label rotation angle to 90 degrees.

image


image

After

Summary:

In this post, I’ve looked at simple properties that can extend chart’s functionality: Showing data labels, configuring axis interval, and rotating axis labels.

~Sam.

Read contents of a file to variable – SSIS

Sometimes you will find the need to import a file to a variable using SSIS. In this post, I’ll use Script Task to read contents of a flat file into a variable.

I’ve created a file called ‘myfile.txt’ with some random text. I’ll configure script task to read this file into a SSIS variable.

  • First create a variable with string data type. I’ll call mine vText.
  • Drag a script task onto the control flow. As you would imagine double clicking the script task will open the editor.
  • Specify the variable you just created as a ReadWriteVariable.
  • Click edit script and use code similar to what you see below:

'initialize StreamReader class for text file
Dim streamReader As New StreamReader("D:\Documents\myfile.txt")
' Read the StreamReader To End and assign to local variable
Dim StreamText As String = streamReader.ReadToEnd()
' assign SSIS variable with value of StreamText local variable.
Me.Dts.Variables("vText").Value = StreamText

To test, I’ll add another script task. This task will show a message box with the contents of our variable. Following is the script i use for message box:

MsgBox(Dts.Variables("vText").Value.ToString)

As you can see I’m reading the file from a static location on my D drive. Most people, however, will use variables or expressions to read from any locations dynamically.

@SamuelVanga.

#meme15 – Use. Twitter. Why?

Should an average Jane or Joe professional use twitter?meme15new

Yes.

Why?

Because, I’m using it.

Not enough reasons? <grumpy face> I knew you wouldn’t buy this.

Okay, allow me to present why you should:

Advertise.

You might be thinking, “I’m neither an author nor do i have any business to advertise”. True, but do you have a blog? Are you working on any interesting project? Are you a character? If the answer to any of these questions is yes, then yes, you’ve something to advertise.

Follow your interests.

Twitter makes it easy to follow your interests: people, events, or anything else, so you can stay up to date of what’s happening around your interests. I’ll use me as an example: I follow a (very) few people. No, I don’t follow celebs like @KimKardashian or @justinbieber – I don’t care what they do – oh, sorry, my interests don’t match theirs. Instead, I follow people from whom I learn new things, people whom I find interesting, people those inspire me. If any of those people write a new article, I want to know about it. With Twitter, i can know the news from all the people at a single place.

Interact.

Example. Mine. Again.

I follow Marco Russo (blog|@Marcorus). Marco tweeted that he was doing a session on Vertipaq vs OLAP.

image

I was excited about it and wanted to attend, but couldn’t. I tweeted this.

image

A tweet appeared magically from Marco saying, hey Sam – you are awesome, this session has been recorded for you. Ha, I’m dreaming here. But you can see his tweet below:

image

This shows how Twitter makes it easy for a novice like me to interact with a master like Marco.

Wrap it…

I’m sure there are other ways to achieve these – but don’t you want to pick the horse that wins the race?

There are more reasons, oh yes, more. Need’em? Sure. Fantastrateic bloggers are giving more reasons here, while participating in this month’s #meme15, created by Jason Strate (t).

When you are ready to start using Twitter, read this free simple twitter e-book by Brent Ozar (@BrentO). You will thank me later.

See ya on the Twitter world…

@SamuelVanga

FIRST_VALUE() Analytic Function–SQL Server 2012

Given a customer table:

CREATE TABLE Customers
(CustId INT, OrderDate DATE, OrderAmount MONEY) ;

INSERT Customers VALUES
(1, ‘2011-12-03’, 12500)
, (
1, ‘2011-10-07’, 15000)
, (
1, ‘2011-09-12’, 16000)
, (
2, ‘2011-07-11’, 900)
, (
2, ‘2011-09-13’, 18000)
, (
2, ‘2011-11-03’, 7000)
, (
3, ‘2011-01-29’, 19000)
, (
3, ‘2011-04-19’, 1000)
, (
3, ‘2011-07-09’, 12000) ;

Let’s say, we want to retrieve all records along with a column showing the customer’s date of first purchase.

We could start by computing the date of first purchase for each customer.

SELECT CustId, MIN(OrderDate) FirstPurchaseDate
FROM   Customers
GROUP BY
CustId

Result set has one row per each customer.

image

Joining this to the original table will return the expected results.

SELECT c.*, firstD.FirstPurchaseDate
FROM   Customers c
INNER JOIN
(
SELECT CustId, MIN(OrderDate) FirstPurchaseDate
FROM   Customers
GROUP BY
CustId
)firstD
ON firstD.CustId = c.CustId

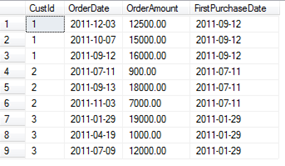
Result set:

image

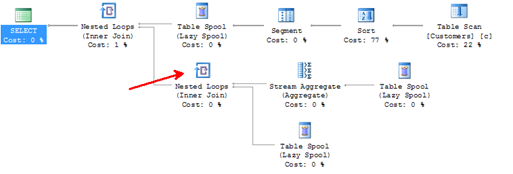
The query plan uses a nested join because of the join we were using the query above.

image

We can achieve the same results using the FIRST_VALUE() function.

SELECT
c.CustId, c.OrderDate, c.OrderAmount
, FIRST_VALUE(OrderDate) OVER(PARTITION BY CustId ORDER BY OrderDate) CustomerSince
FROM
Customers c

[PARTITON BY CustId], creates a partiton for each customer. [ORDER BY OrderDate] sorts each partition by the OrderDate. Now, from this ordered result set, FIRST_VALUE() returns the first value for each partition.

The query is easier to read and a join is not needed. Result: the nested loop is eliminated in the query plan. This could improve performance.

image

I’ll conclude with a question for you to understand LAST_VALUE(). From the same fictitious customer data, let’s say we want to compute the recent purchase date (as opposed to first purchase date from above example) of every customer. What would be the query? I welcome your response in the comments below.

@SamuelVanga

Management Studio Split Tabs

This is by far the simplest and silliest post ever, but i just figured how to create vertical tabs in management studio. When I learn something, you have to read it. I apologize, but you have to read it. As Ellen DeGeneres says, “if I see something… you have to see it” (YouTube Video).

When I want to compare scripts, I would open management studio in two separate windows and compare them. I knew there is an easier way, but didn’t know how to do that until recently.

Right click on a tab and choose – New Vertical Tab Group.

image

Split vertical tabs can be seen in the image below.

image

Note that you won’t see the new tab group options unless you have more than one tab open. Horizontal tabs can be created by clicking on New Horizontal Tab Group.

When done, you can reset the tabs to the original position by clicking on Move to Previous Tab Group.

image

I’m sure you know this – but like I said earlier, if I learn something…!

@me.