How Do You Ensure Data Integrity in Cubes?

A friend of mine recently asked for assistance on creating a custom DLL. I’m a total n00b at this. But, i asked him, why he was pulling his hair over this.

He wants the DLL to implement data integrity in the cube. For example, in a customer dimension with SSN as an attribute, he was hoping, a DLL can be created to ensure that SSN is always 9 digit number.

I had no clue. However, I’ve suggested him to use constraints in the sql table, source data warehouse itself. Check constraint on SSN column can get the job done.

There are many benefits of using constraints in the data warehouse for this particular case:

  • Check constraints are simple. Even people like me, with no knowledge on DLL’s can maintain them.
  • They ensure that data in the warehouse is clean. You don’t want to allow 15 digit number for SSN, for example.
  • Only the data warehouse contains source data for cubes. And if data here is clean, there is no way bad data is entered into the cube. At least in the perfect world.
  • With clean data in the warehouse, reports can consume data from either warehouse or cubes.

What’s your approach?

What would be your approach to this problem? Did you create a DLL? What other solutions do you have?

You are welcome to post a comment below.

~Sam.

7 Free Tools Every Database and BI Developer Must Have

It was Thanksgiving in the US last week. As a way to say thanks, I wanted to use this space to give a shout out to free tools that help me in my day-to-day work.

Click on the following links to know more and download.


Previous Row T-SQL (Part2/2)

I started a two part series on linking to the previous rows. In the first part, I’ve showed how to calculate running totals using T-SQL. In this post i will discuss another problem which also requires linking to previous row fron the result set. Calculating change from the previous row.

Test Data:

I use the same sample data that was used for part 1 of this post. It has Yr and SaleAmount for each year.

How to calculate change from previous row?

Suppose you want to calculate the change of SaleAmount from current year to the previous year.

Using CTE

; WITH cteChangefromPrevious
AS
(
SELECT
Yr
, SaleAmount
, ROW_NUMBER() OVER(ORDER BY Yr) Row_Num
FROM
#YrSales
)
SELECT
Cur.Yr
, Cur.SaleAmount
, Cur.SaleAmount - Prev.SaleAmount
FROM
cteChangefromPrevious Cur
LEFT OUTER JOIN
cteChangefromPrevious Prev
ON Cur.Row_Num = Prev.Row_Num + 1

Row_Number function inside the CTE assigns unique row numbers to each year as a new column (Row_Num).

In the outer select query I join the CTE to itself using a left outer join is joining CTE with itself. Join condition current row = (previous row + 1) causes the query to return SaleAmount for previous year. Minus operation between the previous row and current row retrieves the differnece between two values.

Conclusion

You’ve seen three approaches to this problem, linking to previous rows. Correlated sub query, cross join, and CTE. Using sub query is the popularly used method. But it is worth it try the other methods also.

~Sam.

Previous Row T-SQL (Part1/2)

Calculating running totals, difference from the previous row are common problems. The tricky part to resolve these problems is to be able to link to the previous row. This first part of a two part series in which i discuss options to solve this probelm. I start with running totals.

Test Data:

For this post i use the following script to create and populate sample data. Note that i use row constructors introduced in SQL Server 2008. Below script won’t work as is in version prior to 2008 unless inserted using multiple insert statements.

CREATE TABLE #YrSales
(
Yr INT
, SaleAmount INT
)

INSERT #YrSales
VALUES
(2007,15000)
,(
2008,10000)
,(
2009,25000)
,(
2010,20000)
,(
2011,18000)

How to calculate running totals:

Using Sub Query:

Following query uses a correlated sub query inside the select clause. Correlated sub query executes once for each row returned by the outer query. I originally learned this method from an article by Itzik Ben-Gan, who obviously doesn’t need any introduction.

SELECT
Yr, SaleAmount
,RunningTotal = (SELECT SUM(SaleAmount) FROM #YrSales WHERE Yr<= A.Yr)
FROM
#YrSales A

Suppose the first row returned is Yr = 2009; SaleAmount = 25000. Sub query performs a sum of SaleAmount for all the years less than or equals 2009 and returns 50000as RunningTotal. This continues until there are no more rows returned by the outer query.

Using Cross Join:

Using cross join is an efficient way especially when dealing with larger data sets. Cross joining the table with itself causes every row from the left table (a) to be joined to every row in the right table (b). Where clause ensures that join is performed only when Yr from the right table (b) is less than yr from the left table (a). Yr, SaleAmount from left table (a) in the select clause return Yr and SaleAmount. Sum(b.SaleAmount) returns running total.

SELECT a.Yr,
a.SaleAmount
,SUM(b.SaleAmount) AS RunningTotal
FROM #YrSales a
CROSS JOIN #YrSales b
WHERE (b.Yr <= a.Yr)
GROUP BY a.Yr,a.SaleAmount
ORDER BY a.Yr,a.SaleAmount

To better understand, execute the following queries one at a time:

SELECT
a.Yr,
a.SaleAmount
FROM
#YrSales a
CROSS JOIN
#YrSales b

SELECT
a.Yr,
a.SaleAmount
FROM
#YrSales a
CROSS JOIN
#YrSales b
GROUP BY
a.Yr,a.SaleAmount

SELECT
a.Yr,
a.SaleAmount
,SUM(b.SaleAmount) RunningTotal
FROM
#YrSales a
CROSS JOIN
#YrSales b
WHERE (b.Yr <= a.Yr)
GROUP BY
a.Yr,a.SaleAmount
ORDER BY
a.Yr,a.SaleAmount

SQL Server Views

This post is first of yet to come long series on basic concepts of SQL Server. I’ll begin with basic 101 introduction to SQL Server views. I wouldn’t recommend reading any further if you are an experienced sql server’er. I value your time 🙂

What are views?

  • virtual tables
  • named select statements

Where are views used?

  • to simplify underlying data model for users
  • to implement security mechanism
  • anywhere a table is expected

How to create views?

Create View t-sql command is used to create a view. Following is a sample from AdventureWorks database. Views are defined by the underlying query (select statement that creates it). Views contain rows and columns that were returned by the underlying query.

CREATE VIEW dbo.[vEmployee]
AS
SELECT
c.[FirstName]
, c.[LastName]
, [StateProvinceName] = sp.[Name]
, [CountryRegionName] = cr.[Name]
FROM
[HumanResources].[Employee] e
INNER JOIN [Person].[Contact] c
ON c.[ContactID] = e.[ContactID]
INNER JOIN [HumanResources].[EmployeeAddress] ea
ON e.[EmployeeID] = ea.[EmployeeID]
INNER JOIN [Person].[Address] a
ON ea.[AddressID] = a.[AddressID]
INNER JOIN [Person].[StateProvince] sp
ON sp.[StateProvinceID] = a.[StateProvinceID]
INNER JOIN [Person].[CountryRegion] cr
ON cr.[CountryRegionCode] = sp.[CountryRegionCode]

A select query can be used to retrieve data from the view.

SELECT * FROM dbo.vEmployee

If you are following along and executing the scripts so far you will notice that selecting from a view will return a result set (rows and columns).

How are views stored?

Unlike tables, contents of a view aren’t physically stored. Only the underlying query is given a name and saved on the server. Okay Mr.Genius, if the contents of a view are not saved how did selecting a view return data? I am glad you asked.

SQL Server internally replaces view with the underlying query and reads                                                                                                        select * from <view name> as select * from <underlying query>.

Uses of Views:

Most of the OLTP databases are highly normalized; which means data is spread across multiple tables and naturally joins will have to be used to retrieve this data making it difficult for report writers and other users. Views like dbo.vEmployee can be used to hide all the complexity from users. They form a simplified layer between database and users.

Views can also be used to implement security mechanism. Imagine a student table with ID, Name, SSN, and DOB. Not all the users should have access to SSN of students, a view can be created with only ID, Name, and DOB and users be granted access to this view limiting them from viewing SSN.

~Sam

Every ebook from Apress for $15

Query Performance Tuning. Grant Fritchey. $15. If this doesn’t excite you, nothing will. Apress is offering every e-book for just $15 on Nov. 26. Here is a list of books I’m purchasing and recommend to you.

SQL Server 2012 Integration Services Design Patterns

I already bought this, and I love it. I even wrote a review. If you work with SSIS and don’t have this book yet, you should buy it now. This will be the best 15 dollars you will ever spend on your career.

2012 Query Performance Tuning

I’ve said enough about this book in the first three words of this post. I was putting it off for a while, and now there are no excuses.

SQL Server 2012 Practices

I don’t do DBA stuff at work, still I enjoy learning about things that impact me; like release management, auditing, etc., This book has it all. I hope to apply the practices I learn from this book in my playground – dev environment, that is.

Proceed to check out

Regular price of these books is somewhere around $35 to $50. Some people (including me) may find that expensive, specially when you purchase several books. This offer gives a nice break, who doesn’t want to save some money?

These are just the books I’d buy based on my interests – Remember all ebooks are available for this price.

Don’t miss out on this deal!

Follow me on Twitter!  @SamuelVanga

PASS SQL Saturday World Map

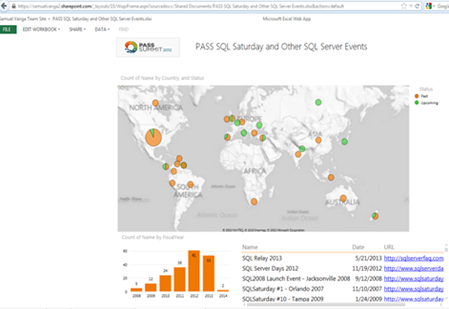
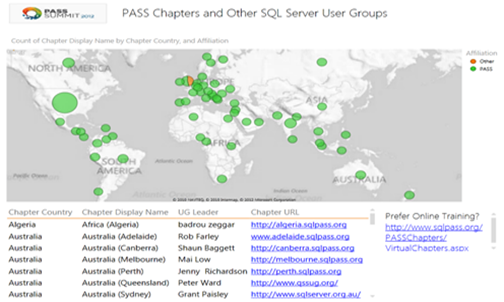
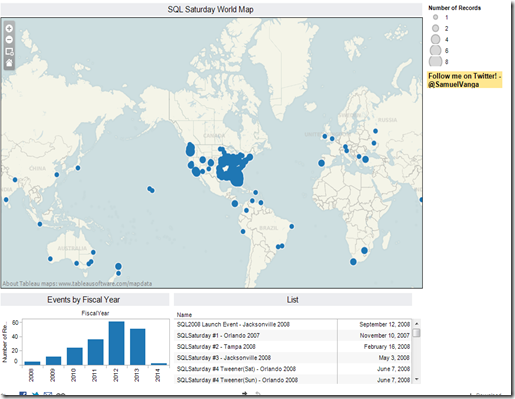
I had the pleasure of helping Karla Landrum (@Karlakay22) for the PASS Summit 2012 by creating two dashboards: SQL Saturday events and PASS Chapters on a world map. If you attended either SQL Saturday round table or Community Zone at the Summit, you may have seen them.

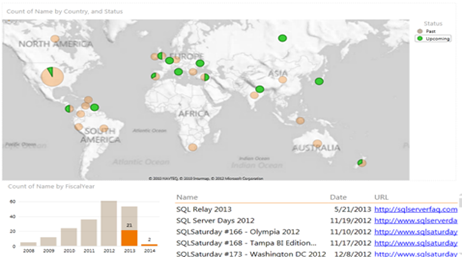
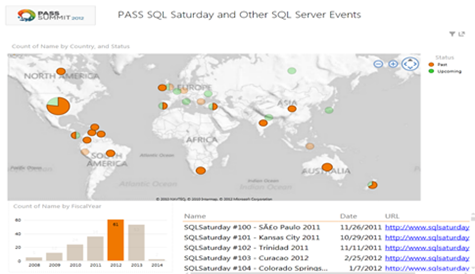
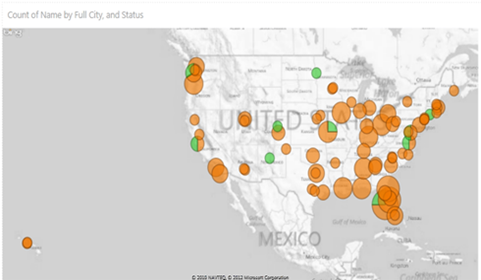
I used PowerView for Excel 2013 preview to create them and deployed to Office 365 SharePoint preview. Preview license will eventually expire, and those dashboards will be gone. So I thought I’d save them on this blog.

Since PowerView dashboards can’t be published for public access, I created similar dashboards using Tableau Public. If you’re interested in SQL Saturdays, I suggest you bookmark this page, because I plan on updating this view as new events are added in the future.

Clicking on the below image opens in a new window.

SQL Saturday World Map Dashboard

Tip: Use the + and – icons on the top left to zoom in and zoom out for a better experience!

PowerView Screen Prints

And, here are the screen prints people saw at the Summit, created using PowerView.

SQL Saturday Events on a World Map:

SQLSaturdayPowerViewworldmap_thumb5

Highlight Upcoming Events:

Upcoming_thumb4

Highlights Events for a Fiscal Year:

2011_thumb3

Drilldown by Country:

US_thumb4

User Groups by Country:

UG_thumb3

You too can create these with PowerView. Here is how:

Download Excel 2013 preview from here, and the workbook I used from here. Dan English (@denglishbi) wrote an article titled PowerView meet Excel 2013 part1 and part2. That helps you get started. Dan also wrote a book on PowerView you may to check out. I haven’t read the book yet, but I heard good things.

Conclusion

I hope you enjoyed this post. If you saw these maps at the Summit, please let me know what you thought either by leaving a comment below or by sending a tweet to @SamuelVanga. I’d greatly appreciate that.

I enjoyed every bit of volunteering on this project for Karla and PASS. I appreciate the opportunity. Karla, Thank you! And thanks to Niko Neugebauer for his constant feedback to make the dashboards look better.

I’m glad I was able to help!

PASS Summit 2012 Twitter Dashboard

As a business intelligence developer, my skills include taking the raw data, shaking it to remove all the junk, and presenting it to business users in the most sexiest way possible – smart people often use the words ETL, and BI to define this process, but I’m not smart – I neither have glasses nor a French beard. ^_^

Since I missed the Pass Summit 2012, I closely watched twitter feed for #sqlpass. Oh boy! That was amazing! There are believers (#PASSPrayers), first timers (#sqlfirsttimers), karaoke’rs (#sqlkaraoke), repeating offenders (Alumni), runners (#sqlrun) to name a few, making This a perfect family (#sqlfamily).

That was me watching #sqlpass tweets btw
OMG! So close.

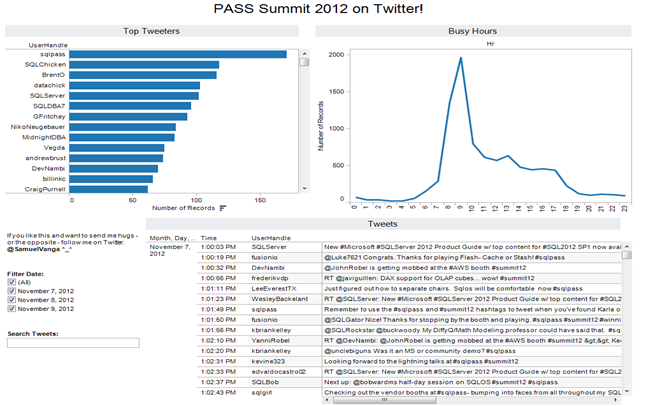
Then, I put my skills to work. Through out the summit I collected tweets that were coming in with #sqlpass and other hashtags mentioned above, imported them to a database, and created the following dashboard.

See PASS Summit 2012 as it happened on twitter. Click the image below to interact (opens in a new window).
PASS Summit 2012 Twitter Dashboard - sqlpass

Charts on the top show the top tweeters and the busiest hours. Times are shown in Pacific Standard Time. Clearly, people tweeted more during the keynote sessions and there are cool people in the top tweeters list.

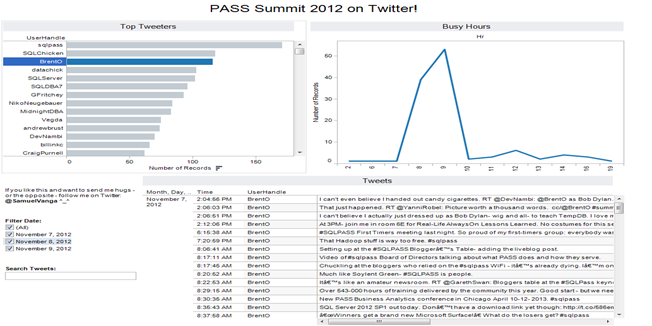
When you select a tweeter, all views in the dashboard are filtered for that particular user. For example, in the below image I select BrentO (Brent Ozar). You can see everything Brent tweeted and tweets over time.
image

Similarly, you can select a time to see everything for that hour.

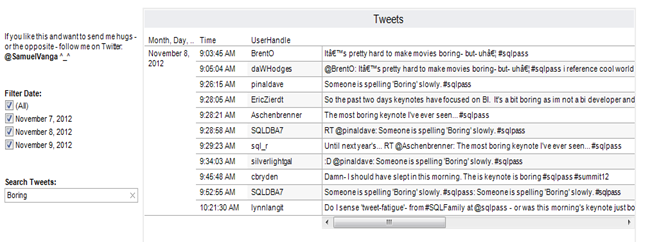
Last functionality I show is searching tweets. Enter a term in the search tweets filter area in the bottom left. For example, I enter ‘Boring’ to get this:
image

Good news: there are only a few tweets that reflect a boring event. Bad news: there are tweets suggesting that the event (at some point) is boring. You can see when attendees felt boring. Don’t get me wrong – It’s not my intention to convey that Summit was boring. A good BI solution tells business users when and where there are problems.

Database Backup

Download the database backup from here. It’s a SQL Server 2012 RTM database. There are three tables:

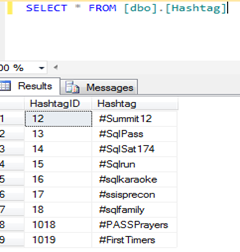
dbo.Hashtag contains all the hashtags that were collected. HashtagID is an identity column.
image

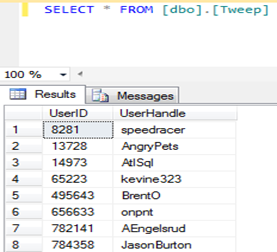
dbo.Tweep is a table to store tweeters. UserID is the unique Twitter ID for a user, it’s not Identity in the database.
image

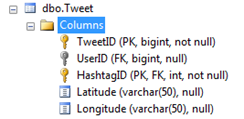
dbo.Tweet is used to store tweets. TweetID in this table is again an unique ID generated by Twitter. Note that TweetID alone isn’t unique in this table. Primary key is TweetID + HashtagID.
image

This query removes duplicates and gives you unique tweets. Change the filter conditions as you like.

USE HashtagArchive ;

WITH cte
AS
(
SELECT tp.UserHandle
      
, tw.CreateDate
      
, tw.Tweet
      
, tw.Latitude
      
, tw.Longitude
      
, PST = DATEADD(HH,-8,CreateDate)
       ,
RowNum = Row_Number() OVER( Partition BY tw.TweetID ORDER BY (SELECT NULL))
FROM   dbo.Tweet tw
      
INNER JOIN dbo.Tweep tp
      
ON tw.UserID = tp.UserID
      
INNER JOIN dbo.Hashtag ht
      
ON ht.HashtagID = tw.HashtagID
WHERE  ht.Hashtag IN ('#Summit12', '#SqlPass','#Sqlrun','#sqlkaraoke','#sqlfamily','#ssisprecon','#PASSPrayers')
       AND
CreateDate > '2012-11-07 08:00:00.000'
)
SELECT UserHandle
      
, CreateDate
      
, PST
      
, [Date] = CAST(PST AS DATE)
       ,
[Time] = CONVERT(VARCHAR(8),PST,108)
       ,
Hr = DATEPART(HH,PST)
       ,
Tweet
      
, Latitude
      
, Longitude
FROM cte WHERE RowNum = 1
ORDER BY CreateDate ;


There is some noise with the #FirstTimers hashtag. I didn’t think young US citizens who voted for the first time would be on Twitter, strange! Make sure to avoid that and you’ve an archive of Twitter database for PASS Summit 2012.

Follow me and leave a comment

Too much to ask, I know! If you enjoyed this post, follow me on twitter (@SamuelVanga) – I’d love to get to know you. And leave a comment with what you discover from this dashboard.

Enjoy!

Related Posts

SQL Saturday US Map – Posted 08/03/2012

Update: 11/12/2012 08:00 PM

Chris Webb (@Technitrain on Twitter), MVP and BI Expert posted  an example using NodeXL to analyze tweets. Check it out – It’s amazing!
Create Several Shell SSIS Packages In Minutes Using BIML

What do i mean by shell packages? You’re spot on – that’s an excellent question to begin with. For the purpose of this post, I define shell package as an empty package that is renamed appropriately and contains all the required connection managers.

It is a common pattern among SSIS developers to create separate packages for each unit of work. For example, you will create a package for each table that needs to be loaded.

The only problem: manually creating hundreds of packages, sometimes even more, is time consuming and boring. If you think about it, first steps of creating all these packages is always the same: Right click on SSIS Packages, select New SSIS Package, rename the package, and create Connection Managers.

Wouldn’t it be nice if there is a way to automate these boring steps? I hear you screaming yes.

Package templates help you to some extent. You create a package with the required connection managers and save it as a template. The subsequent packages will automatically contain all connection managers the template has, you don’t have to add them manually to all packages. You still have to add and rename packages though.

Let’s take a look at a much better and time saving method!

I use BIML to dynamically create multiple SSIS packages for each table that needs to be loaded. All packages will be renamed consistently and will contain connection managers.

Demo:

Execute the following SQL to create source and destination databases.

CREATE DATABASE SrcDatabase ;

CREATE DATABASE DestDatabase ;

Next, create some tables in the destination database.

USE DestDatabase;
GO

CREATE TABLE dbo.DimProduct (
ProductKey INT IDENTITY(1, 1) PRIMARY KEY
,ProductCode VARCHAR(10) UNIQUE
) ;

CREATE TABLE dbo.DimCustomer (
CustomerKey INT IDENTITY(1, 1) PRIMARY KEY
,CustomerCode VARCHAR(10) UNIQUE
) ;

CREATE TABLE dbo.DimEmployee (
EmployeeKey INT IDENTITY(1, 1) PRIMARY KEY
,EmployeeCode VARCHAR(10) UNIQUE
) ;

Again, our objective is to create one package for each of the tables in the destination database.

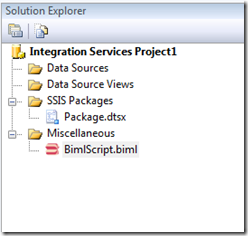
Open BIDS, I’m using SSIS 2008R2 for this example. You’ll have to install BIDS Helper from here. Right click on the project and add New BIML File. Your solution explorer look like this:

image

Double click the BIML file and paste the following script. If you see issues while copy pasting, check this link.

<#@ template language=”C#” hostspecific=”true”#>
<#@ import namespace=”System.Data” #>

<Biml xmlns=”http://schemas.varigence.com/biml.xsd”>
<Connections>
<Connection Name=”SrcDatabase” ConnectionString=”Data Source=(local);Initial Catalog=SrcDatabase;Provider=SQLNCLI10.1;Integrated Security=SSPI” RetainSameConnection =”true” DelayValidation =”false”/>
<Connection Name=”DestDatabase” ConnectionString=”Data Source=(local);Initial Catalog=DestDatabase;Provider=SQLNCLI10.1;Integrated Security=SSPI;” RetainSameConnection =”true” DelayValidation =”false”/>
</Connections>
<Packages>

<# string DestCnStr =”Data Source=(local);Initial Catalog=DestDatabase;Provider=SQLNCLI10.1;Integrated Security=SSPI”;
DataTable tables = ExternalDataAccess.GetDataTable(DestCnStr,”SELECT t.name FROM sys.tables t”) ;
foreach (DataRow row in tables.Rows)
{ #>
<Package Name=”Load_<#=row[0]#>” ConstraintMode=”Linear” >
<Tasks>
<Container Name=”Dummy — remove container” ConstraintMode=”Linear”>
<Tasks>
<ExecuteSQL Name=”Dummy — remove task” ConnectionName=”SrcDatabase”>
<DirectInput>select 1</DirectInput>
</ExecuteSQL>

<ExecuteSQL Name=”Dummy 1 — remove task” ConnectionName=”DestDatabase”>
<DirectInput>select 1</DirectInput>
</ExecuteSQL>
</Tasks>
</Container>
</Tasks>

</Package>
<# } #>
</Packages>
</Biml>

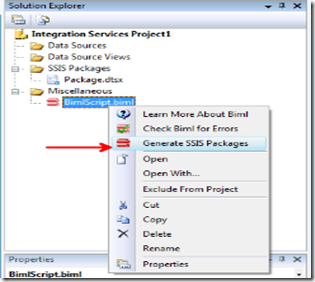
After copying the code, right click on the BIML file and select Generate SSIS Packages.

image

Bingo!

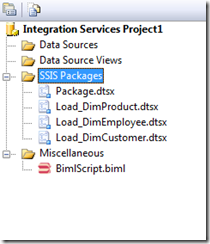
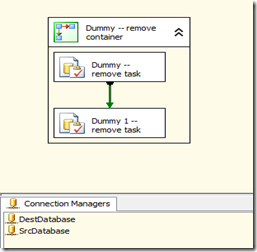
Multiple packages with connections managers have been created in a matter of minutes.

image

You just have to delete the sequence container and proceed with package development. Why?  We created connection managers in the BIML script, but since we are not using them anywhere in the package, they won’t be included in the packages. So, I tricked it by creating a dummy task. This is still easier compared to the traditional process of creating multiple packages.

image

Don’t get me wrong. This example is probably the most basic of what BIML has to offer. I’m spending some time lately with BIML and I hope to do more posts as I learn new things.

Reference: http://bimlscript.com/Browse/Snippets

@SamuelVanga

I’m Not Attending #sqlpass Summit 2012 and I’m Sorry For Myself

I really wanted to attent PASS Summit this year, I’ve never attended before. I was preparing myself mentally since the last summit, but things didn’t work out. Life happened. I’ve some personal obligations that I need to take care. I can’t talk much about these obligations here, but I can say I’ll be a happy man if I complete them. So, I decided to trade Summit – not an easy decision though.

I know I’m going to miss out on a lot of things, Pre-Con Session: SSIS Design Patterns the most. Hopefully, I’ll be able to attend next year and get to meet all the awesome SQL people.

You, my friend, if you have a chance and haven’t registered yet, don’t wait. From what I’ve heard and learnt, it will be an amazing experience. Here is the registration link.

~Sam.